BRC plant ecologist Oli Pescott has published a review paper in the journal of the Botanical Society of Britain & Ireland (BSBI) investigating how BRC and the BSBI might go about exploring changes in species distributions from these data. Now that the BSBI have finished the data collecting phase of their “Atlas 2020” project, staff and volunteers are turning to questions of data validation and analysis. Investigating changes in species’ distributions over time is a key aspect of this, and involves careful thought in bringing together BSBI data with appropriate statistical models.
BSBI data, like those of many biological recording schemes, contain many biases that have the potential to seriously mislead the unwary. Many of these biases can be traced to differing approaches to data collation over time. In the first BSBI Atlas, published in 1962, data were summarised at the 10 x 10 km (hectad) scale, the resolution at which the Atlas maps were published. Although some field data were collected at finer resolutions, most of these data have never been digitised, so most of the BSBI data for the 1950-1969 “date-class” are resolved to the coarse level of 10 x 10 km. Other trends in data collation and databasing have also waxed and waned over time; for example, see the “stream graph” of typical British grid-based data resolutions over time for Scotland below.
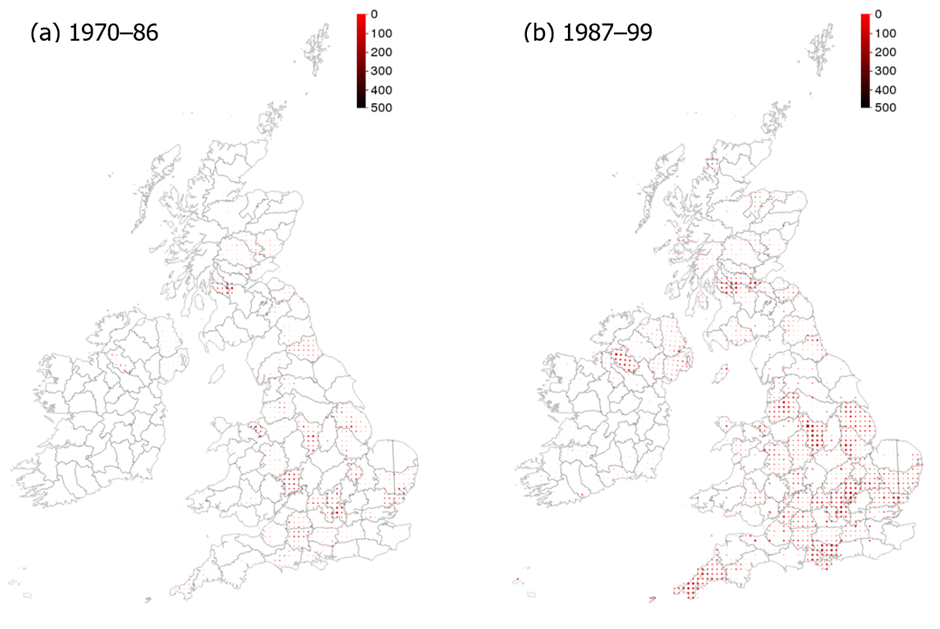
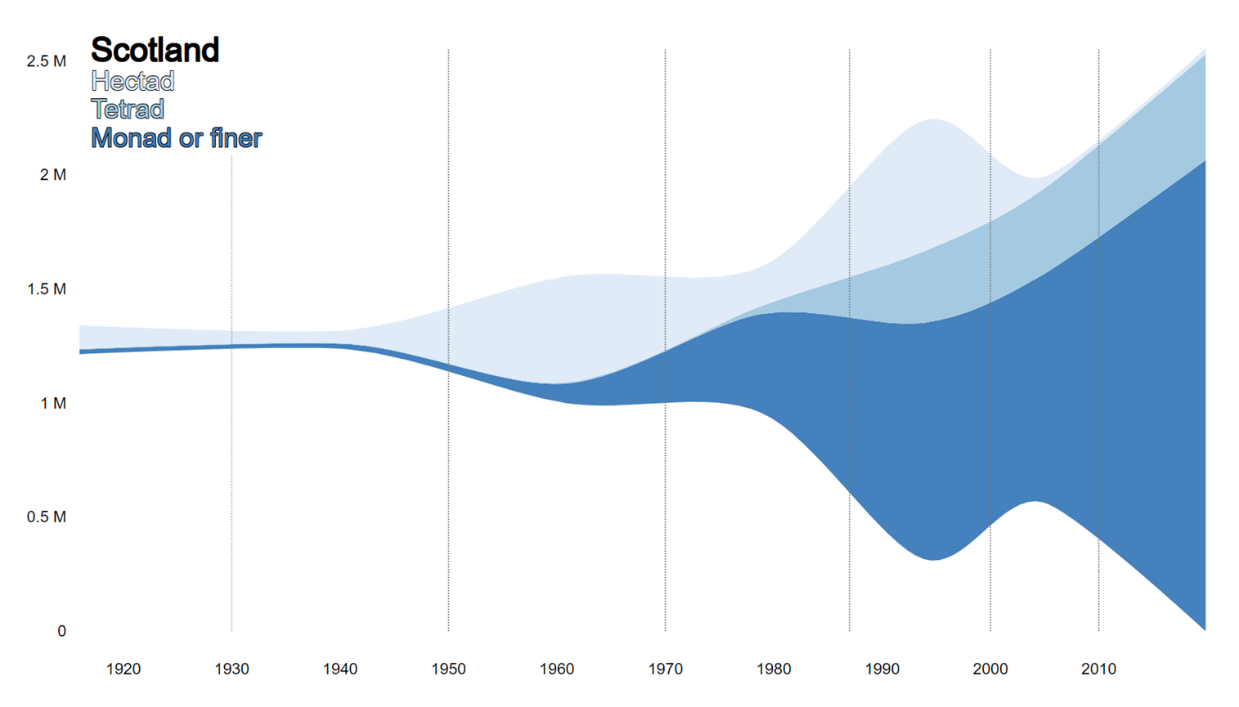 Hectad data can be seen to predomiate in the period 1950-69, and are also common for 1987-99, the two periods covering the last two national BSBI Atlases. Coupled with actual changes in recording effort in terms of boots on the ground, it will be seen that naively interpreting changes by merely counting squares at some scale is unlikely to be a sensible strategy. Moreover, working at finer scales such as the tetrad (2 x 2 km) or monad (1 x 1 km) will also be seen to present huge challenges from the figure above: not only are there huge increases in the data held at these scales in the BSBI database over time, but we also have no reason to expect these finer scale data to be representative samples of most species within these periods. When the data-basing of fine-scale data was the exception rather than the norm, it was often only special cases, such as national rarities or critical taxa, that made it through to the database. Only gradually have finer-scale data accumulated in the BSBI database; as shown in the figure from the review paper below, even between 1970-86 and 1987-99 the increase in digitised data representing tetrad (or finer) scale day-visits was clear (and spatially patterned).
Oli’s paper reviews these aspects of BSBI data, and the model-based correctives that have been put-forward to adjust for them. Many options exist, although understanding how they might be applied, and what their strengths and weaknesses are relative to any real-world dataset, presents challenges. Various properties of BSBI data, in particular the increasing numbers of records at fine spatial and temporal scales over the past century, coupled with a general lack of re-visits to sites at such scales, and the presence of time-varying biases, all imply that methods that can be sensibly applied at coarser levels are likely to be most appropriate for estimating accurate long-term trends in distributions.
One such method is Mark O. Hill’s local frequency scaling or “Frescalo” approach. This technique can in theory be applied at any spatial scale, but is particularly well-suited to landscape scales across which Atlas recording coverage has typically been relatively good, such as the 10 x 10 km scale in Britain and Ireland. Where fine-scale datasets have changed their spatio-temporal composition significantly over time, working at such aggregated scales reduces the chances of bias and also minimises waste: all data can be used. The ingenious part of Mark’s approach is to use the relative frequencies of species within local areas in specific time periods to adjust for recording effort. Because these local areas, or “neighbourhoods”, are defined biogeographically, rather than by an administrative or recording unit such as the vice-county, this also allows for spatially-patterned biases in recording effort to be smoothed out to some extent. The Frescalo approach was also recently used to analyse British plant data for the State of Nature 2019 (see page 95 of the report for details), and we look forward to more insights from the BSBI Atlas 2020 results.
Ultimately, all statistical inference based on biased (i.e. non-probability) samples comes at a price, and that price is the assumptions that are made by an analyst. Plausible assumptions may take us a long way, but implausible ones may seriously undermine our confidence in our results. Oli’s paper is a great example of how detailed knowledge of a complex dataset can be required in making sensible choices of appropriate statistical models. Having our boots firmly on the ground is just as much a virtue in modelling as it is in fieldwork!
This article was published in the BRC Newsletter June 2020