Red Listing and Indicators

Current Activity

In the past, species’ status was often assessed on expert opinion, or by counting the number of occupied grid cells. Our recent work has used computer simulations of the recording process to inform how we can estimate the trends in species status over decadal timescales. BRC is working with recording schemes, government agencies and partner organisations to derive quantitative trend estimates and other metrics for use in Red Listing and the development of biodiversity indicators to assess the 2020 ‘Aichi targets’.

Key Outputs

Building upon earlier atlases, trend estimates were presented in recent atlases for ladybirds (2011), hoverflies (2011), dragonflies (2014) and bryophytes (2014).  We continue to work with recording scheme experts to extend the availability of trend information to a much wider set of species groups.  The State of Nature Reports (2013 & 2019) to which BRC contributed trends for over 1,000 species, highlighted declines in UK wildlife. The Priority Species Indicator tracks changes in the status of over 200 species of conservation concern.

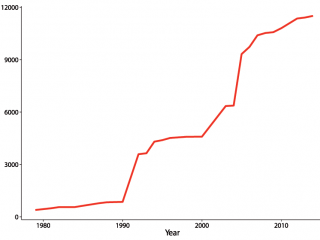
Growth in threatened species status assessments

Growth in species over time

Figure: Nick Isaac, CEH.

The cumulative number of UK taxa (species and subspecies) that have been formally assessed against criteria for conservation prioritisation.

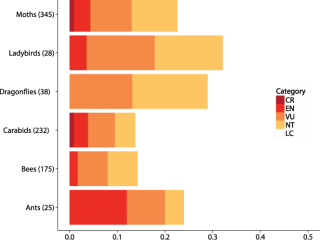
Provisional extinction risk assessment of 1026 species using biological records.

Proportions of species in extinction categories

Figure: Nick Isaac, CEH

Species were assessed against IUCN criterion A2c, based on rates of decline in frequency of occurrence since 2000. The categories are Critically Endangered (CR: >80% decline), Endangered (EN: >50%), Vulnerable (VU: >30%), Near Threatened (NT: >20%) and Least Concern (LC: stable or increasing).

The Priority Species Indicator, using biological records

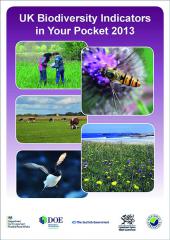
Cover of UK Biodiversity Indicators in Your Pocket

Photo: © JNCC

For the first time in 2013, the UK Government published a biodiversity indicator based solely on opportunistic biological records data. The indicator included ~230 insects (mostly moths & bees) listed as conservation priorities by the four national governments of the UK.

Future Challenges

Sophisticated statistics make it possible to estimate quantitative measures of species’ trends (IUCN criterion A) and range size (criterion B) using biological records. In doing so, these models make a number of assumptions about how the data are collected.  As analytical tools become more widely adopted, our challenge is to harmonize how criteria are applied across taxa and regions.  Clear guidelines are needed to resolve conflicts between model results and expert opinion in order to provide robust species trend information.


References

Boyd Robin J., Powney Gary D., Burns Fiona, Danet Alain, Duchenne François, Grainger Matthew J., Jarvis Susan G., Martin Gabrielle, Nilsen Erlend B., Porcher Emmanuelle, Stewart Gavin B., Wilson Oliver J., Pescott Oliver L. (2022) ROBITT: A tool for assessing the risk-of-bias in studies of temporal trends in ecology. John Wiley & Sons, Ltd,
Boyd Robin J., Aizen Marcelo A., Barahona-Segovia Rodrigo M., Flores-Prado Luis, Fontúrbel Francisco E., Francoy Tiago M., Lopez-Aliste Manuel, Martinez Lican, Morales Carolina L., Ollerton Jeff, Pescott Oliver L., Powney Gary D., Saraiva Antonio Mauro, Schmucki Reto, Zattara Eduardo E., Carvell Claire (2022) Inferring trends in pollinator distributions across the Neotropics from publicly available data remains challenging despite mobilization effort. John Wiley & Sons, Ltd,
Korner-Nievergelt Fränzi, Strebel Nicolas, Buckland Stephen T., Freeman Robin, Gregory Richard D., Guélat Jérôme, Isaac Nick J.B., Rae Louise Mc, Roth Tobias, Schirmer Saskia, Soldaat Leo L., Voříšek Petr, Sattler Thomas (2022) Multi-species population indices for sets of species including rare, disappearing or newly occurring species. ,
Hordley Lisbeth A., Powney Gary D., Tom Brereton, Gillings Simon, Petchey Owen L, Roy Helen, Tobias Joseph A, James Williams, Oliver Tom H. (2022) Developing a national indicator of functional connectivity. ,
Coomber Frazer G., Smith Bethany R., August Tom A., Harrower Colin A., Powney Gary D., Mathews Fiona (2021) Using biological records to infer long-term occupancy trends of mammals in the UK. ,
Bowler Diana E., Eichenberg David, Conze Klaus-Jürgen, Suhling Frank, Baumann Kathrin, Benken Theodor, Bönsel André, Bittner Torsten, Drews Arne, Günther André, Isaac Nick J.B., Petzold Falk, Seyring Marcel, Spengler Torsten, Trockur Bernd, Willigalla Christoph, Bruelheide Helge, Jansen Florian, Bonn Aletta (2021) Winners and losers over 35 years of dragonfly and damselfly distributional change in Germany. John Wiley & Sons, Ltd,
Freeman Stephen N., Isaac Nicholas J. B., Besbeas Panagiotis, Dennis Emily B., Morgan Byron J. T. (2021) A Generic Method for Estimating and Smoothing Multispecies Biodiversity Indicators Using Intermittent Data. ,
Sheard Julie K., Rahbek Carsten, Dunn Robert R., Sanders Nathan J., Isaac Nick J. B. (2021) Long-term trends in the occupancy of ants revealed through use of multi-sourced datasets. ,
Taylor P., Smallshire D., Parr A., Brooks Stephen J., Cham S., E. Colver, Harvey M., D. Hepper, Isaac N. J. B., M. Logie, D. McFerran, F. McKenna, Nelson B., Roy David B. (2021) State of Dragonflies 2021. ,
Schmucki R., Sevilleja C., Dennis E.B., Harrower C.A., Kazlauskis K., Rathod B., van Breda G., van Breda J., Van Swaay C.A.M., Roy D.B. (2020) Tools to support butterfly monitoring and analysis. Technical report. Butterfly Conservation Europe, Wageningen, The Netherlands