The Targeting Revisits Maps is an interactive tool giving biological recorders information to discover the places near them to go recording. There are Targeting Revisits Maps for six taxonomic groups and over the past 5 years we’ve had great feedback from users. This year we’ve improved the tools and added a great new feature.
We’ve kept the design simple so you can still identify where records are “most needed” based on whether squares have records from only one year in the past (the pink ‘targets for revisits’) or multiple years (the green ‘multi-year’ squares).
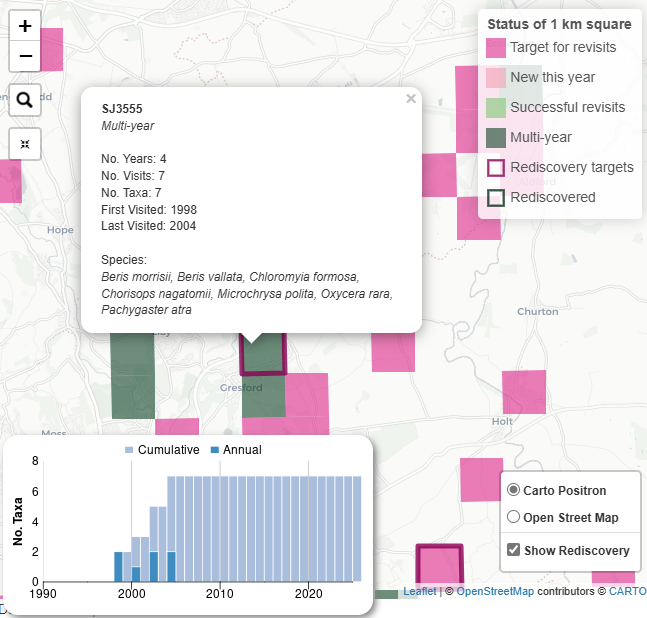
New to the maps for 2025 is the option to view ‘Targets for Rediscovery’. This helps you focus your recording even more to benefit the Recording Schemes. Targets for rediscovery are sites that have records of 4+ species but haven’t got records for 10+ years. Are those species still present? Will a new recorder find any new species?
Our improvements are based on feedback from recorders – feedback has been positive, but where people have been suggestions for improvements, we’ve listened. Also new for this year is the pop-up graph – when you click on any 1km square - showing the species per year, and a choice of basemaps to make the records easier to view. And we’ve improved some of the wording (using the term ‘multi-year’ instead of ‘well recorded’ so reduce any confusion).
These maps are updated every day from iRecord. Can you make records to turn the pink squares green, or visit one of the targets for rediscovery? Remember – one-off records are great but, when visiting squares, it’s always best to record as many species (for your taxonomic group) as you can find – that makes yours records even more valuable.
Explore the Targeting Revisits Maps. Where will you go next?
Targeting Revisits Maps are available for:
Further information on the background to Targeting Revisits is available here.
Let us know what you think
Have you had a look at the Targeting Revisits Maps? Are they helpful for you and do they inspire you to record? Please give feedback to Michael Pocock.
The Targeting Revisits Maps were developed by Colin Harrower at UKCEH with support from NERC and the JNCC through the TSDA (Terrestrial Surveillance Development and Analysis) partnership. We thank Brian Valentine and Charlie Jackson for permission to use their images on the targeting revisit map pages.
* We define ‘targets for revisits’ based on the use of the data in Trend Distribution analysis (which feeds into the State of Nature reports and is used in research). For more details on our approach see our previous news article.
Michael Pocock, 6 June 2025