To help wildlife recorders make the most of their time out recording insects, we’ve created the Targeting Revisits Maps to guide people to where records of some of these species are most needed.
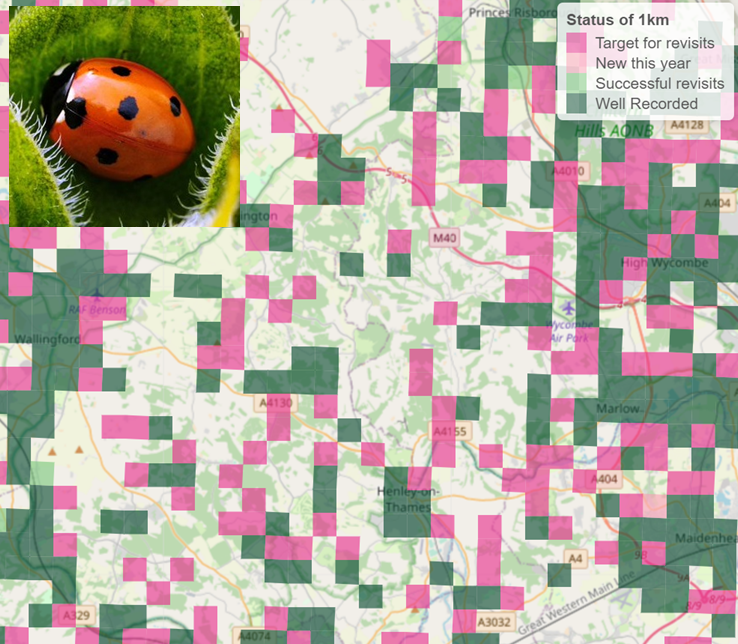
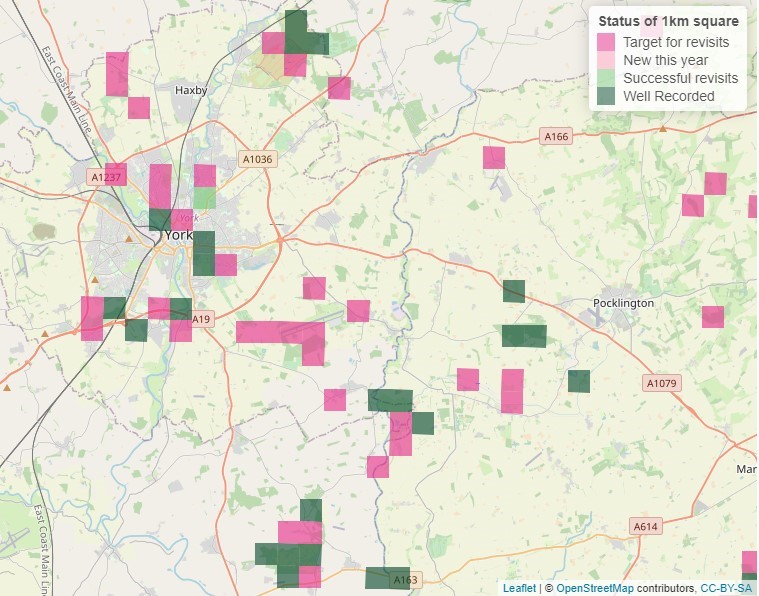
A Targeting Revisits Map shows the pattern of recording in 1 km grid squares and highlights squares that are ‘multi-year’ (with records from more than one year) and squares that are ‘targets for revisits’ (with records from only one year in the past). Can you visit squares and make records, and so turn the pink squares green?
We have Targeting Revisits Map for:
- Craneflies
- NEW in 2025: Dragonflies and damselflies
- Grasshoppers and bush-crickets
- Ground beetles
- Ladybirds
- Soldierflies
When visiting a location (whether green, pink or blank on the Targeting Revisits Maps), we encourage you to search well and record all the species that you see in the square for that taxonomic group. Submit your records via iRecord (website, or the apps available for iOS and Android); they will appear on the map almost immediately, and be available to be verified by experts.


Why is this useful?
At the Biological Records Centre at UKCEH we use records submitted to National Recording Schemes for many different purposes. One purpose is using 1 km grid square records to calculate trends in occupancy. But – here’s the important point – the way that we analyse the insect records to calculate trends in occupancy only uses data from sites visited in more than one year. However, there are many, many sites across the country that have records only from one year. (Here we describe a ‘site’ as a single 1km square, and use records from 1990 up to the current day. See ‘more information’ below for details about the analysis.)
If people revisited sites that previously had been visited in only one year, then we could include data from more sites in our analyses - and so we’ve created this mapping tool to easily show people where these sites are: the challenge is to turn the pink squares to green by revisiting them this year!
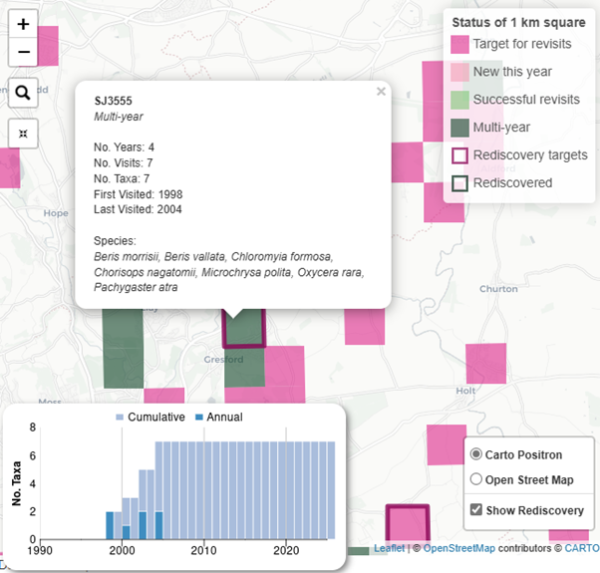
Based on feedback from users, we’ve added the option to view ‘Targets for rediscovery’ in the latest version of the maps (from 2025). Targets for rediscovery are sites that have records of 4+ species but haven’t had records for 10+ years. Records from these sites are especially valuable to understand changes in distribution. Are those species still present? Have new species arrived?
Each site (a 1km square) is classified according to its visits:
| Colour | Key legend | Explanation |
| Dark pink | Targets for revisits | Sites that have records from only one year in the past – if these sites are revisited then they can be included in our trend analysis. |
| Pale pink | New this year | Sites that, for the first time, have records from this year. Next year these will become targets for revisits. |
| Dark green | Multi-year | Sites that already have records from multiple years – these sites are already included in our trend analysis, but of course records from these sites continue to be valuable. |
| Pale green | Successful revisits | Sites that used to only have records from a single year, but since this year have visits from multiple years and will now be included in our trend analysis. |
| Pink border | Rediscovery target | Sites that have records of 4 or more species in the past, but have no recent records (within the past 10 years). (Select “Show Rediscovery” in the Targeting Revisits Maps to view.) |
| Green border | Rediscovered | Sites that have records of 4 or more species in the past (over 10 years ago) and have records again from this year. (Select “Show Rediscovery” in the Targeting Revisits Maps to view.) |
| Blank | Unrecorded | Sites that, so far, don’t have any records of this group in our database. |
(Strictly speaking, we base these classifications on records submitted this year, so records from past years that have been submitted this year count as ‘new’ to the database. However, in most cases, ‘new’ records will be those made and submitted this year.)
More information on the Targeting Revisits Maps
- The Targeting Revisits Maps are provided to help inform where you might choose to record these species based on patterns of recording in the past. It highlights sites (in bright pink) that have records from only one year in the past. Revisiting these sites would be helpful for analysis of species trends with the BRC occupancy models that we use for insect trend analysis. All records remain valuable for different purposes, including other forms of analysis (e.g. Frescalo), spatial distribution modelling and red listing.
- The ‘rediscovery targets’ are sites that have records of 4+ species but haven’t had records for 10+ years. Revisiting them can provide richer information on change in species over time. Although these are arbitrary cut-offs, we discussed with people from the recording schemes to select sensible figures.
- The maps include expert-verified data from the species covered by the relevant recording scheme (Cranefly Recording Scheme, British Dragonfly Society, Grasshoppers and Allies Recording Scheme, Ground Beetle Recording Scheme, Soldierflies and Allies Recording Scheme, and UK Ladybird Recording Scheme).
- There may be other records available that have not been passed to the recording scheme, so the maps may not represent all the data that are available. Please get in touch with the scheme organiser if you are aware of data that could be added to these datasets.
- How are the maps updated? The Targeting Revisits Map uses the latest data from iRecord and is updated at least every few days. Be aware that recent records have not been verified, so this map should not be viewed as authoritative – see the Recording Scheme websites listed below for more details.
More information on recording these species
- Note that all records are valuable for understanding the distribution and trends of these species, wherever they are from. Please keep recording whether or not you use the Targeting Revisits Maps!
- It is especially valuable to submit ‘lists’ of species. A list is all the species you recorded at a location on a particular date, not just one-off, ‘special’ or notable species. Recording lists of species from repeated visits to the same site within and across years provides the best possible information for analysis of trends.
- It is best to submit your records via iRecord so that they can readily be included in the Recording Scheme databases and will enable the Targeting Revisits Map to be updated promptly. You can use the iRecord website or iRecord app. The fully illustrated iRecord Grasshoppers app (currently only for Apple devices) provides support for recording grasshoppers and bush-crickets. All the records go to the same database.
- Please only record species that you are confident of identifying, or where you can provide a photo (or sound recording) to help verify the records.
- The Recording Scheme websites for Craneflies, Dragonflies and damselflies, Grasshoppers and allies, Ground beetles, Soldierflies and allies and Ladybirds give more details about recording these species.
Let us know what you think
Have you had a look at the Targeting Revisits Maps? Are they helpful for you and do they inspire you to record? Please send feedback or requests for further information to Michael Pocock [email protected]
The Targeting Revisits Maps were developed by Colin Harrower at UKCEH with support from NERC and the JNCC through the TSDA (Terrestrial Surveillance Development and Analysis) project.
We are grateful to Brian Valentine and Charlie Jackson for permission to use their images.